
CBSE 10th Class past year question paper
Year 2019
SET 1, Code Number- 30/2/1
Question number – 27

Lost your password? Please enter your email address. You will receive a link and will create a new password via email.

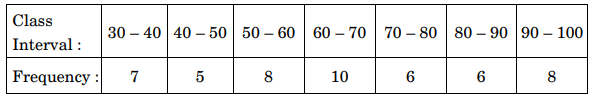
CBSE 10th Class past year question paper
Year 2019
SET 1, Code Number- 30/2/1
Question number – 27

Plotting of points (40, 7), (50, 12), (60, 20), (70, 30), (80, 36), (90, 42) and (100, 50)
Joining the points to get the curve